
[ A Practical Guide Inspired by the CISS-Red_Cluster_Monitor Project ]

Project Design Purpose : This article walks through a lightweight, self-hosted server/VM cluster monitoring system built with Python, InfluxDB, and Grafana, designed specifically to handle the special or customized requirement for monitoring the security labs, CTF environment, OT networks, or isolated clusters. Instead of relying on a black-box agent, you’ll build your own custom data collectors and monitor that fetch metrics from exactly the sources you need—whether that’s IPMI, network probes, or application-specific endpoints—push them into a secure, local time-series database and visualize the data with customized dashboards.
The practical example in this article is inspired by the CISS-Red_Cluster_Monitor project, which was developed to monitor a sandboxes cluster (400+ VM) used for supporting a red team cybersecurity CTF competition. To make the design clear and reproducible, the article is structured around four main parts:
-
Core Design Idea – The overall system architecture, including the agent/fetcher model and communication flow.
-
Security Config Choice – How the system is designed to prevent participants from reverse-engineering agents or sending fake metrics.
-
Technology Stack – The tools used (
Python,InfluxDB,Grafana, etc.) and how to install and configure them. -
Data and UI – How data is stored, visualized in dashboards, and summarized or alerted (e.g., via Grafana and Telegram).
# Author:           Yuancheng Liu
# Created:          2026/01/27
# Version:           v_0.2.1
# Copyright:       Copyright (c) 2025 Liu Yuancheng
# License:	   GNU General Public License
1. Introduction
There are several free or commercial tools in the market for supervising servers and VM clusters like PM2 which can monitor the workload, network latency, and services running in physical server, docker or virtual machines with very little setup. But some times we may have some special or customized requirement such as:
-
Can’t directly install agents on some certain devices
-
Need to collect power and hardware telemetry from sources like IPMI instead of OS-level agents
-
The system must run in a fully local / air-gapped environment with no internet access
-
Need to visualize the custom data collection and validation logic.
Based on these scenario and requirement, the monitoring system has to be simple and reliable under competition load, secure against tampering or fake data injection, deployable in a restricted network environment and easy for administrators to visualize and audit in real time.
1.1 Usage Case Background And Objectives
For example, the CISS-Red Stage One CTF event required continuous monitoring of multiple physical servers and virtual machines over a 48-hour period to ensure infrastructure stability and enable rapid incident response. The monitoring objective was to track key metrics in real time—including host servers CPU and memory usage, network latency, service availability of the CTF challenge VMs, and user SSH login activity—and to present all of this information through a centralized, intuitive dashboard. Whenever an abnormal condition was detected, the system would automatically send alert notifications to the support and administrator Telegram groups.
2. System Architecture
The monitoring system adopts a Information-fetch-based agent architecture, where a central monitor hub actively pulls data from distributed agents instead of having agents push data upstream. This design choice is driven primarily by security considerations: in a CTF environment, participants may attempt to reverse-engineer agent code or forge requests to inject fake metrics. By keeping all data collection under the control of the central hub, the possible attack surface is significantly reduced and unauthorized data submission can be effectively prevented.
From an architectural perspective, the system follows a simple three-tiers design as shown below:
┌──────────────┐         ┌──────────────┐         ┌──────────────┐
│  Physical    │         │  Physical    │         │  Physical    │
│  Server 1    │         │  Server 2    │         │  Server N    │
│  ┌────────┐  │         │  ┌────────┐  │         │  ┌────────┐  │
│  │ Agent  │  │         │  │ Agent  │  │         │  │ Agent  │  │
│  │(Python)│  │         │  │(Python)│  │         │  │(Python)│  │
│  └────────┘  │         │  └────────┘  │         │  └────────┘  │
│      │ Local │         │      │ Local │         │      │ Local │
│      │Storage│         │      │Storage│         │      │Storage│
└──────┼───────┘         └──────┼───────┘         └──────┼───────┘
       └────────────────┬───────┴────────────────────────┘
                        │ HTTP Fetch Requests(Pull Mode)
                        ▼
              ┌──────────────────────────┐
              │  Monitor Hub (Collector) │
              └────────┬─────────────────┘
                       │ Write Metrics
                       ▼
              ┌──────────────────────────────────┐
              │   InfluxDB(Time-Series Database) │
              └────────┬─────────────────────────┘
                       │ Query Data
                       ▼
              ┌──────────────────────────────────────┐
              │    Grafana Dashboard (Visualization) │
└──────────────────────────────────────┘-
Agent Layer – Several lightweight Python agents deployed on, or connected to, monitored nodes to collect system and service metrics.
-
Storage Layer – An InfluxDB time-series database used to efficiently store and query monitoring data.
-
Visualization Layer – A Grafana dashboard that provides real-time visualization, historical analysis, and operational overview of the cluster and a message sender to send possible alert via Telegram message.
2.1 System Workflow Detail
The overall system workflow is shown in the diagram below:

In the CISS-Red CTF environment, the participants first SSH into a public IP gateway through the firewall and then access their assigned challenge virtual machines. Each physical server hosting challenge VMs or Docker containers is equipped with two RJ45 network interfaces connected to two isolated networks:
-
Interface 1 (blue path in the diagram) is used exclusively for participant traffic to access the challenge services.
-
Interface 2 (orange path in the diagram) is dedicated to monitoring traffic, allowing the monitoring agents and hub to collect operational data without interfering with or being exposed to CTF participant activity.
This configuration ensures that monitoring traffic does not affect the performance or fairness of the competition environment. From a functional point of view, the system consists of three main components:
-
Service Prober Repository : A reusable python service-checking library that provides multiple probing functions (e.g., NTP, FTP, VNC, SSH, and custom service checks). These probers are used to verify whether a specific node, service, program, or function in the cluster is operating correctly.
-
Prober Agent : A lightweight agent responsible for scheduling and executing different probers to assess the availability and health of one or more targets in the cluster. The agent can run locally on a server to collect metrics directly. For nodes where an agent cannot be installed, the system falls back to SSH-based command execution to retrieve the required data remotely.
-
Monitor Hub : The central monitoring and analysis component, which provides a database backend (InfluxDB) for archiving time-series metrics, a web-based dashboard (Grafana) for real-time and historical visualization, and extensible interfaces for integrating custom logic, such as score calculation formulas or competition-specific evaluation functions.
2.2 Technology Stack
The library and tools used in this project and the related link are shown in the below table :
| Component | Technology | Version | Purpose | Link |
|---|---|---|---|---|
| Programming Language | Python | 3.7.4+ | Agent development | |
| Time-Series Database | InfluxDB | 1.8.10 | Metric storage | https://docs.influxdata.com/influxdb/v1/about_the_project/release-notes/ |
| Visualization Platform | Grafana | Latest | Dashboard creation | https://grafana.com/ |
| System Monitoring | psutil | Latest | CPU/RAM metrics | |
| Network Testing | pythonping | Latest | Latency measurement | |
| Time Synchronization | ntplib | Latest | Timestamp accuracy | |
| Telegram API | Telegram Bot | Latest | Real time alert message | https://www.toptal.com/developers/python/telegram-bot-tutorial-python |
3. System Modules Design
This section describes the detailed design of the three core components of the monitoring system: the Service Prober Repository, the Prober Agent, and the Monitor Hub.
3.1 Service Prober Repository Design
The Service Prober Repository is a reusable python probing library that provides a wide range of functions to check the status of services, programs, and system resources then plug in to the prober agent. All probe functions are designed as modular components and can be grouped into three categories: local service probers, child agent probers, and network service probers.
3.1.1 Local Service Probers
Local service probers run directly on the target nodes and focus on monitoring the node’s internal state, including:
-
System resource usage (CPU, memory, disk, network I/O),
-
User activities (login sessions, command execution, file system changes),
-
Local program and process states (process lifecycle, service ports, log status).
The main local probers are summarized below:
| Prober Name | Probe Action / Coverage |
|---|---|
| Resource Usage Prober | CPU %, memory %, disk usage %, network bandwidth usage |
| User Action Prober | User login, command execution, file system modification |
| Program Action Prober | Process execution, service startup, port status, log checking |
3.1.2 Child Agent Prober
The Child Agent Prober is used to fetch and aggregate data from other prober agents and merge the results into a unified view. This mechanism is especially useful in segmented network environments where certain subnets are only reachable through a jump host and no direct routing is available. By chaining agents together, the system can bridge isolated network segments without changing the existing routing configuration.
3.1.3 Network Service Probers
Network service probers run outside the target nodes and verify service availability and correctness over the network. These probers simulate real client behavior and check whether services are reachable, responsive, and functioning as expected.
| Prober Name | Probe Action / Coverage |
|---|---|
| Server Active Prober | ICMP (ping), SSH login, RDP, VNC, X11/X11:1-Win |
| Service Ports Prober | Customized Nmap-based port scanning for required services |
| NTP Service Prober | NTP latency and time offset correctness |
| DNS/NS Service Prober | DNS name resolution correctness |
| DHCP Service Prober | DHCP broadcast and response check |
| FTP Service Prober | FTP login and directory listing |
| HTTP/HTTPS Web Prober | Web service request/response correctness |
| Email Service Prober | Basic email service availability check |
| TCP/UDP Service Prober | Generic TCP/UDP service connectivity (e.g., Teams, Skype-like services) |
| Database Service Prober | Database connectivity and basic query checks |
These probers together provide comprehensive coverage of both infrastructure health and application-level service availability.
3.2 Prober Agent Module Design
The Prober Agent is responsible for collecting, scheduling, and executing different probers based on a customized configuration profile. Each agent can monitor a single node or multiple targets, depending on deployment needs. The overall workflow is shown in the diagram below.
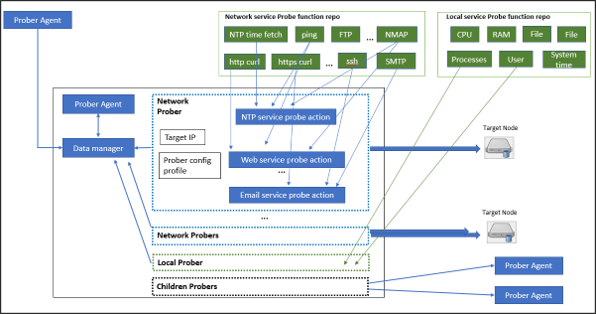
The prober agent provides the following five key features:
-
Profile-Based Configuration : Users can define customized profiles to control which probers run, their execution intervals, and their target scope, making the monitoring behavior easy to adapt to different environments.
-
Inside/Outside Probing : The agent can run inside critical nodes to inspect local system state, or outside to probe the service interfaces of multiple nodes. This allows flexible deployment without requiring an agent on every single node.
-
Custom Prober Plugins : The system provides extension interfaces for users to plug in their own custom probers for application-specific checks (e.g., verifying the status of a billing service or competition scoring service).
-
Data Relay Bus : To avoid changing the original network routing of a cluster, a prober agent can also fetch data from other reachable agents and act as a relay, forming a data collection chain across segmented networks.
-
Multiple Communication Protocols : The agent supports multiple data fetch and reporting protocols (TCP, UDP, HTTP, HTTPS) to adapt to different network security policies and traffic restrictions commonly found in cyber exercise environments.
3.3 Monitor Hub Module Design
The Monitor Hub is the central component responsible for data ingestion, processing, analysis, and visualization. All prober agents report their monitoring results to the hub through a communication manager. The hub then stores, processes, and presents the data to administrators through a web-based interface (currently using Grafana).
In addition to real-time dashboards, the Monitor Hub also provides:
-
A topology view showing the online/offline state of cluster services,
-
And an extension interface for integrating custom scoring or evaluation functions, which is particularly useful in CTF or cyber exercise scenarios.
The data flow architecture is illustrated below :

Two databases are used in the system:
-
Raw Info Database : Stores all collected raw monitoring data from the prober agents for auditing, analysis, and historical reference.
-
State Database : Stores processed and aggregated data that is directly used for visualization and state display.
The Data Manager component retrieves data from the Raw Info Database, performs processing and analysis, applies user-defined scoring functions, and then inserts or updates the results in the State Database. This separation ensures that raw data is preserved while keeping the visualization layer fast and focused on meaningful, high-level metrics.
4. Grafana Dashboard UI and Telegram Alerts
To make the monitoring data actionable and easy to understand, the system uses Grafana to build a set of dedicated dashboards for different operational views. Each dashboard focuses on a specific aspect of the cluster, such as overall service health, physical server performance, network status, or CTF challenge environments. Historical data and real-time metrics are both visualized, allowing administrators to quickly identify trends, anomalies, and incidents.
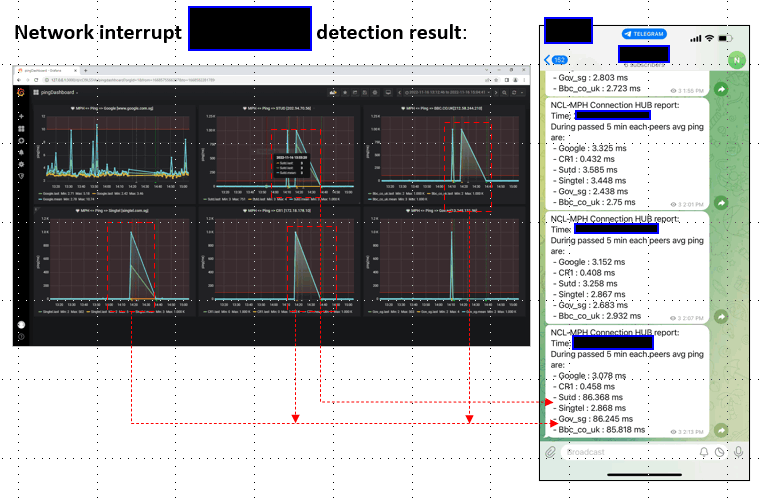
In addition to dashboards, the system integrates a Telegram alert mechanism to notify the support team immediately when abnormal conditions are detected (e.g., high latency, service downtime, or degraded health scores).
4.1 Cluster Main State View Dashboard
The dashboard below serves as the overview page of the entire cluster:
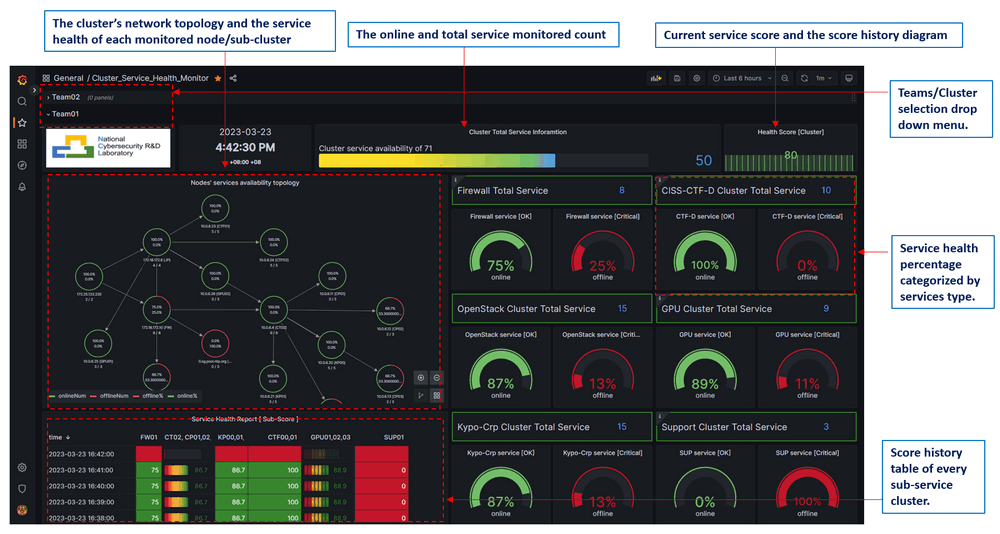
This main page provides a high-level operational snapshot, including:
-
The cluster network topology and the service health status of each monitored physical server/router or sub-cluster,
-
The number of online challenge services compared to the total monitored services,
-
The current health score of challenge Docker containers, pods, and containers, along with their historical score trends,
-
The service health percentage of challenge virtual machines, categorized by service type.
4.2 Physical Server Cluster Monitor Dashboard
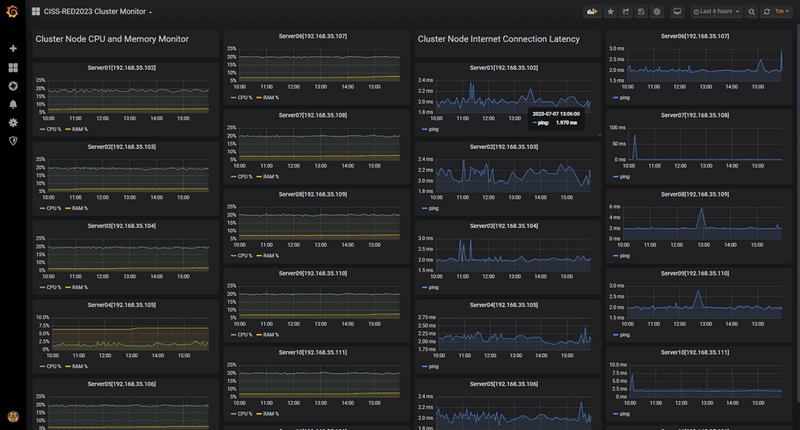
For each physical server, clicking the “Physical Cluster Monitor” link will open a detailed performance dashboard. This page contains 22 small charts arranged in four columns as shown below :
-
Columns 1 and 2 display CPU and RAM usage percentages of the physical servers,
-
Columns 3 and 4 show network latency and bandwidth usage metrics and related network performance indicators.
4.3 Cluster Network Device and Connection Dashboard
For network-level visibility, the “Network Nodes Monitor Dashboard” provides a focused view of infrastructure traffic and connectivity. As shown below:

It is particularly useful for diagnosing network bottlenecks, misconfigurations, or abnormal traffic patterns during the competition with visualizing the outbound and inbound network connections and the firewall traffic flow states.
4.4 CTF Challenge VM and Docker Service Dashboard
The Challenge VM and Docker Service Dashboard focuses on the actual competition environments (VMs, Container and Dockers ) as shown the example below:

This dashboard is typically used by the technical support team to quickly confirm whether a specific challenge environment is running correctly or experiencing service degradation It shows the runtime status and health of Challenge virtual machines, Docker containers and related services and Service availability and stability indicators.
4.5 Telegram Alert Notifications
In addition to visual dashboards, the system provides real-time alerting via Telegram. When a metric exceeds a configured threshold (for example, network latency going beyond the acceptable limit, or a service becoming unavailable), the system automatically sends an alert message to the competition technical support group. An example alert message is shown below:
5. System Deployment and Configuration
In this section, I will introduce how to deploy the monitoring system in a computing cluster environment, including agent installation, hub configuration, database setup, and Grafana dashboard integration.
Step 1: Prepare the Infrastructure on Each Monitored Server
First, ensure that each monitored server has the correct time zone, Python environment, and required dependencies installed:
sudo timedatectl set-timezone Asia/Singapore
sudo apt update && sudo apt install python3 python3-pip -y
sudo pip3 install influxdb pythonping ntplib psutil --break-system-package
Note: Adjust the time zone and package installation method according to your OS and security policy.
Step 2: Deploy Agents on the Monitoring and Monitored Nodes
On each monitored server (or on designated probing nodes), clone the project and configure the agent:
# On each monitored server
mkdir -p ~/monitorAgent
cd ~/monitorAgent
git clone https://github.com/LiuYuancheng/CISSRed_Cluster_Monitor.git
cd CISSRed_Cluster_Monitor/src/client/
# Configure agent
cp config.template.json config.json
vim config.json  # Edit configuration
# Start agent
sudo nohup python3 AgentRun.py > agent.log 2>&1 &
A simplified example of the agent configuration file is shown below:
{
  "agent": {
    "hostname": "server1",
    "collection_interval": 60,
    "http_port": 8080,
    "log_level": "INFO",
    "log_file": "/var/log/monitoring/agent.log"
  },
  "metrics": {
    "system": {
      "enabled": true,
      "collect_cpu": true,
      "collect_memory": true,
      "collect_disk": false
    },
    "network": {
      "enabled": true,
      "ping_targets": [
        "192.168.1.1",
        "192.168.1.254"
      ],
      "ping_count": 4,
      "ping_interval": 60
    }
  },
  "storage": {
    "local_cache_size": 1000,
    "cache_directory": "./metrics_cache"
  },
  "time": {
    "ntp_server": "pool.ntp.org",
    "sync_interval": 3600
  }
}
Step 3: Configure and Start the Monitor Hub
On the central monitoring server, configure the list of agent endpoints:
# On central monitoring server
cd ~/monitorAgent/CISSRed_Cluster_Monitor/src/hub/
# Configure agent endpoints
vim agents.json
# Example agents.json
[
  {
    "hostname": "server1",
    "url": "http://xxx.xxx.xxx.xxx:8080",
    "tags": {
      "role": "compute",
      "location": "rack1"
    }
  },
  {
    "hostname": "server2",
    "url": "http://xxx.xxx.xxx.xxx:8080",
    "tags": {
      "role": "compute",
      "location": "rack1"
    }
  }
]
# Start monitor hub
python3 MonitorHub.py
Step 4: Install InfluxDB and Verify Data Collection
After installing InfluxDB_1.8.10 and creating the required database (e.g., monitorDB), verify that data is being written correctly:
influx
USE monitorDB
SHOW MEASUREMENTS
SELECT * FROM system_metrics LIMIT 10
If measurements are listed and queries return data, the data pipeline from agents to the database is working correctly.
Step 5: Import Grafana Dashboards and Configure InfluxDB Data Source
-
Install Grafana and access the web interface at:
http://<monitoring-server>:3000 -
Log in with the admin credentials.
-
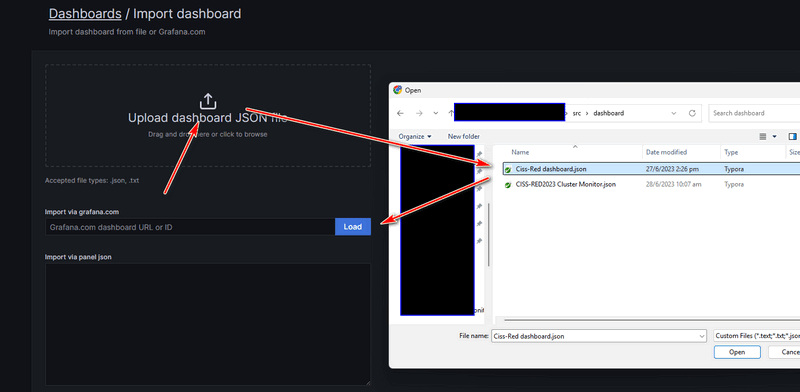
Navigate to Dashboards → Import, then upload the dashboard JSON file (or import using the Dashboard ID):
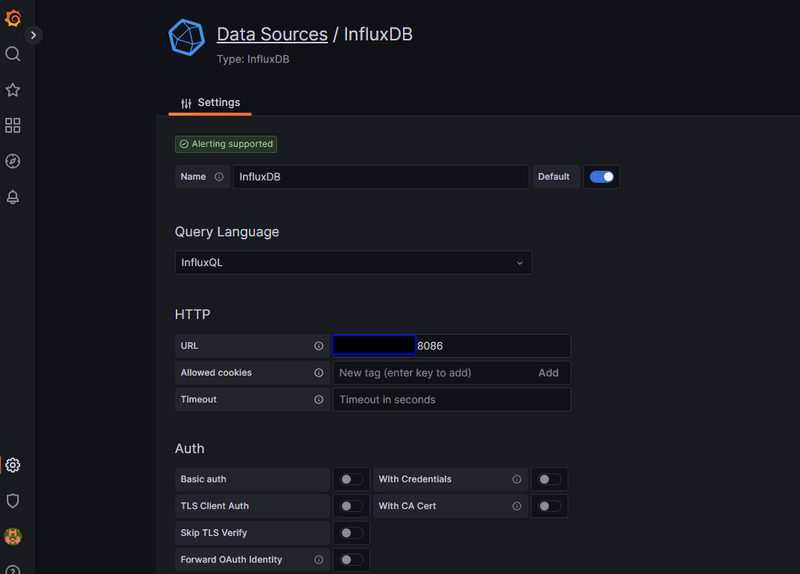
Go to Settings → Data Sources, create a new InfluxDB data source, and fill in the database server IP and credentials as shown below:
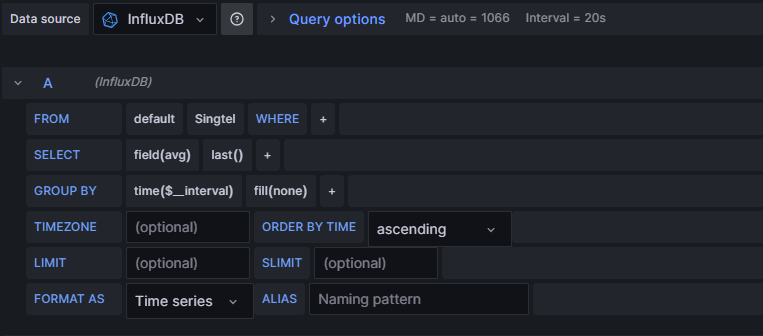
Verify that all panels display data correctly. If a panel shows “No data” as below:

Check whether each agent is running and reachable, verify that the correct data source is selected in the panel settings:
You can also insert test data manually to verify that InfluxDB and Grafana are working correctly:
InfluxDB shell version: 1.8.10
> SHOW MEASUREMENTS ON monitorDB
> SHOW MEASUREMENTS ON gatewayDB
> USE monitorDB
Using database monitorDB
> SHOW MEASUREMENTS
> INSERT cpu,host=serverA value=10
> SHOW MEASUREMENTS
After completing these steps, the cluster monitoring system is fully operational and ready to provide real-time visibility and alerting for your infrastructure.
If you are interested about using the module, you can refer to below repos:
- https://github.com/LiuYuancheng/Cluster_Service_Health_Monitor
- https://github.com/LiuYuancheng/CISSRed_Cluster_Monitor
Thanks for spending time to check the article detail, if you have any question and suggestion or find any program bug, please feel free to message me. Many thanks if you can give some comments and share any of the improvement advice so we can make our work better ~

No comment for this article.