
When developing applications, we often encounter memory issues of an application. To analyze how much memory each class takes, we need to have some specific tools to assist us. One of them is Memory Analyzer Tool on Eclipse.
The Eclipse Memory Analyzer is a fast and feature-rich Java heap analyzer that helps you find memory leaks and reduce memory consumption.
To use the Memory Analyzer Tool, you first need to install it on Eclipse. You can go to Help -> Install New Software.... Paste http://download.eclipse.org/mat/1.4/update-site/ in Work with field and press Enter. Then follow the steps you will be able to install the plugin.
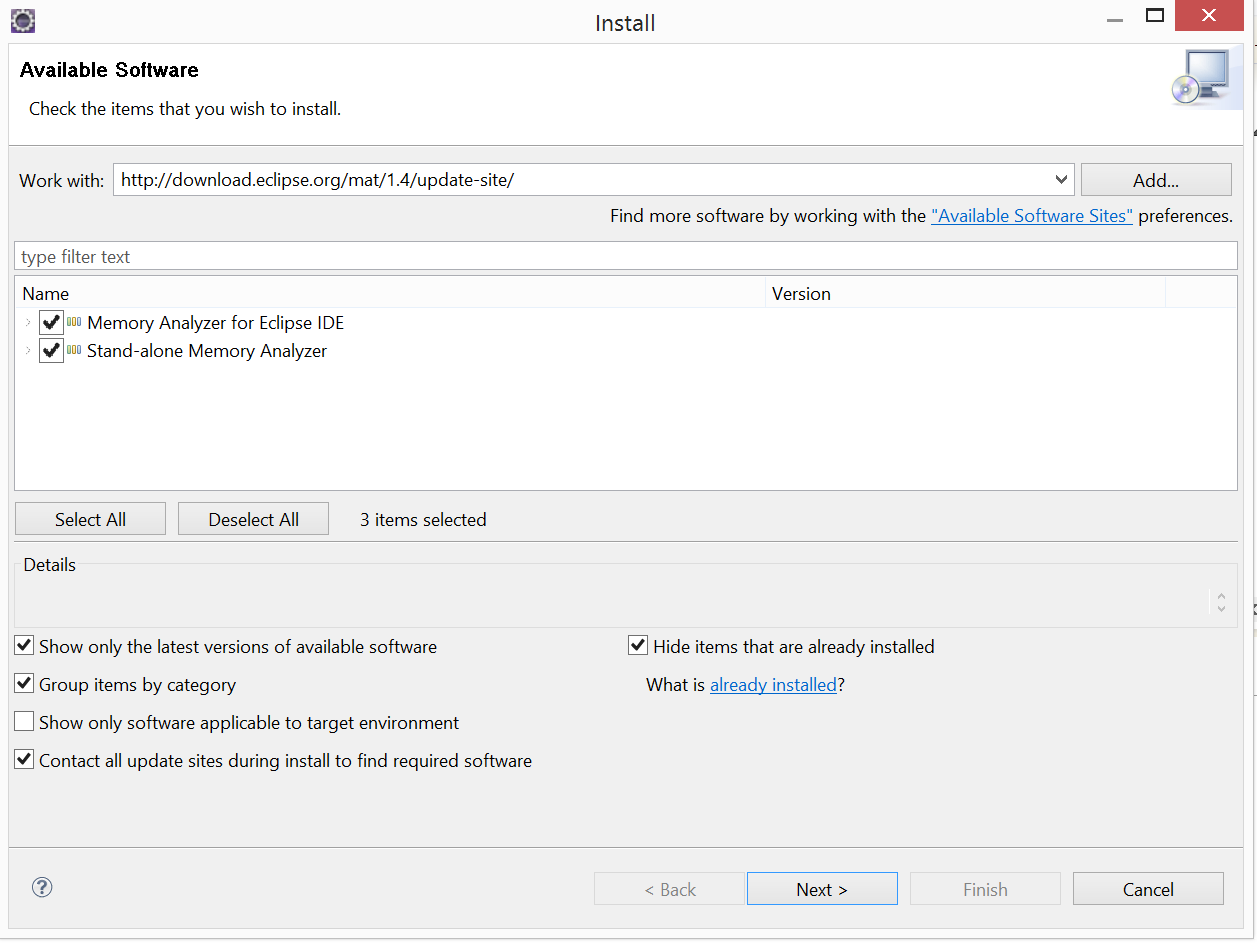
After installing the plugin, you can start to create the application and then take the heap dump of the application when it's running.
Here for example, we have a sample program named MemoryTest and we start to run it.
import java.util.ArrayList;
import java.util.List;

public class MemoryTest {
	public static void main(String[] args) throws InterruptedException{
		List list = new ArrayList();
		System.out.println("Memory test");

		Thread.sleep(10000000);
		System.out.println("Memory test down");
	}
}
Then we go to Window -> Open Perspective -> Other -> Memory analysis
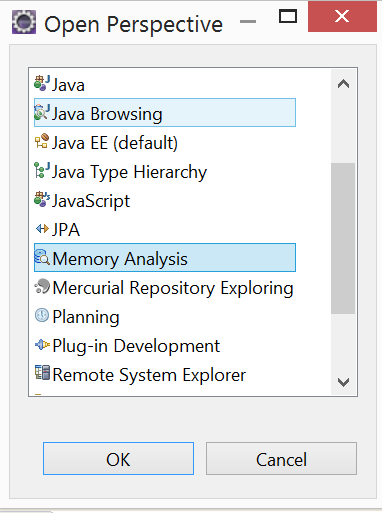
Now the Memory analysis perspective will show. Go to File -> Acquire Heap Dump.... The Acquire Heap Dump dialog will show up for configuration.
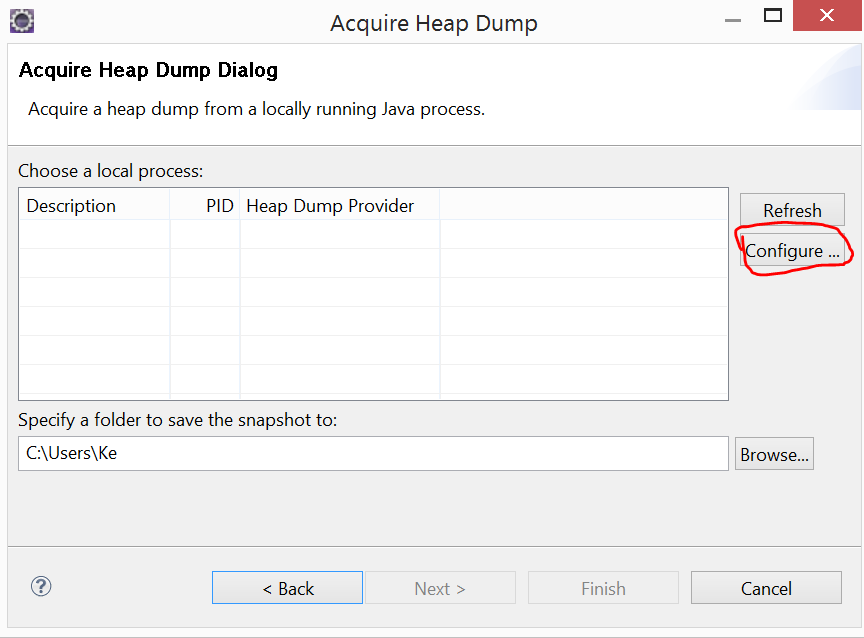
Click Configure..., there should be two available heap dump providers: One is IBM dump and the other is HPROF jnap dump provider. IBM dump provider should be chosen if you are using IBM JDK. If you are using Oracle JDK or other JDKs, you should choose the HPROF provider instead.
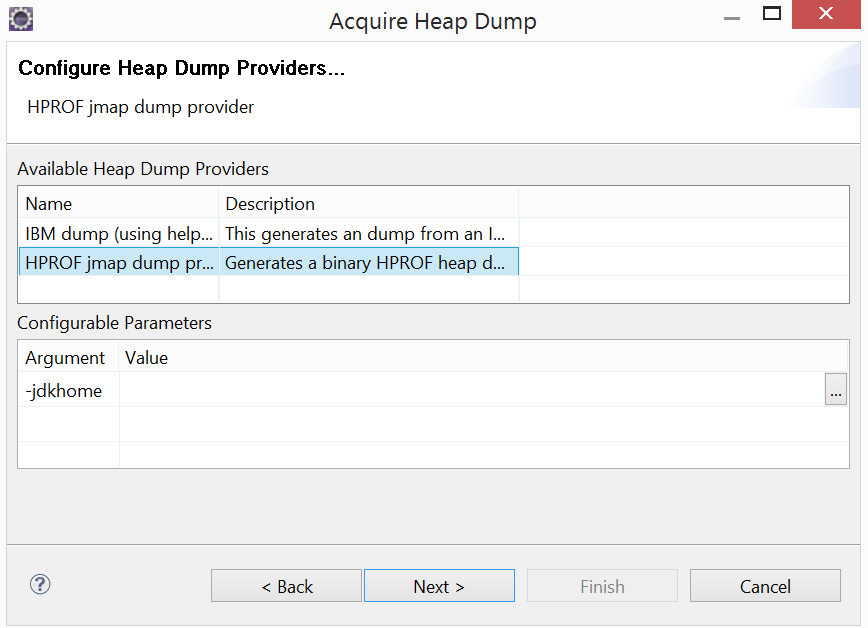
Here we are choosing HPROF provider as we are using Oracle JDK. In the Configurable Parameters field, put the Oracle JDK home directory. Here the JDK directory should be the one which runs the MemoryTest application. Note, it's JDK home directory but not JRE home directory. You know what I mean, right?
After this, you will see the MemoryTest process. You can also specify the location to put the dump file.
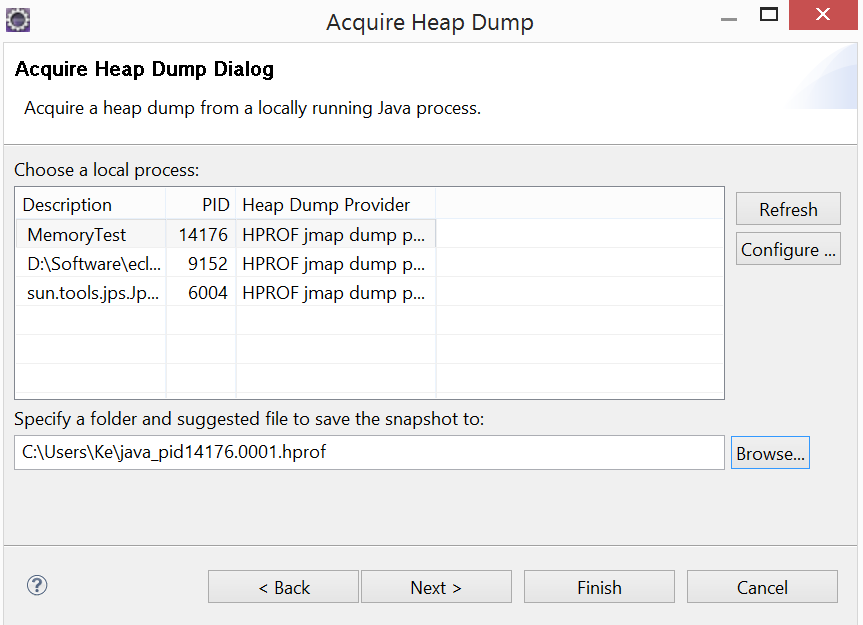
Click Finish, the dump will start. After the dump is completed, you can find the dump file and then start to analyze.
For IBM dump, you can analyze it with IBM Monitoring and Diagnostic Tool.

Thank you, good explanation.