
If you don't know how to debug program, you are not a real programmer.
gdb can be used to debug go program, but according to golang website, delve is a better option.
Note that Delve is a better alternative to GDB when debugging Go programs built with the standard toolchain. It understands the Go runtime, data structures, and expressions better than GDB.
Below is a simple go program.
package main
type Person struct {
	Name string
	Age int
}
func main() {
	var me Person
	me.Name = "Melvin"
	me.Age = 41
	var wife Person
	wife.Name = "Raye"
	wife.Age = 36
	var daughter Person
	daughter.Name = "Katherina"
	daughter.Age = 5
	var son Person
	son.Name = "Vito"
	son.Age = 2
	var family []Person
	family = append(family, me, wife, daughter, son)
	birthdayToday(&daughter)
}
func birthdayToday(person *Person) {
	person.Age = person.Age + 1
}
When using delve to debug, on command console, you just need to run below command.
dlv debug.
And then you can set breakpoint and start the debug journey.
(dlv) help
(dlv) break main.go:29
(dlv) break main.go:31
(dlv) breakpoints
(dlv) continue
(dlv) print family
(dlv) n
(dlv) print family
The output would be like:
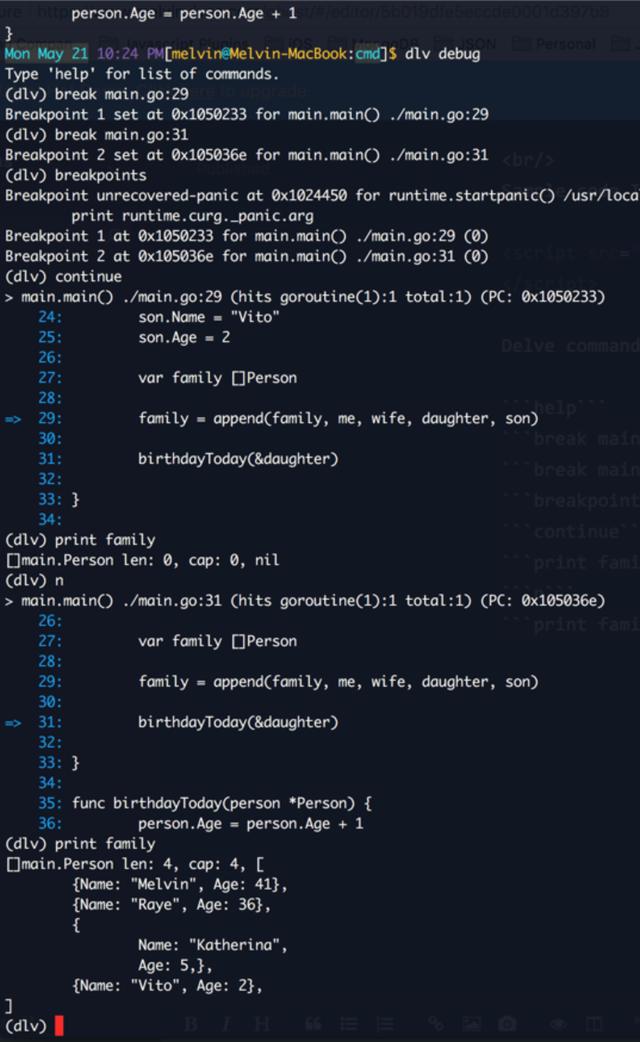
Simple enough.

No comment for this article.